Residents at year end
655,210
31.12.
County · 46
Residents at year end
655,210
31.12.
Gross investment
3,934,814,000 kr
Per resident: 6,005 kr
Net loan debt
92.5 %
Share of gross operating revenues
Net operating result
2.6 %
Share of gross operating revenues
A dash means data is missing or unpublished. Missing figures are never treated as zero. Per-resident figures are calculated by NOMOP using the population at the end of the same year.
Gross operating expenditure for selected service areas. This is not a complete budget and should not be added up as a total.
| Service | NOK | Per resident |
|---|---|---|
| Administration | 604,859,000 kr | 923 kr |
| Upper secondary education | 5,881,009,000 kr | 8,976 kr |
| Dental health | 627,196,000 kr | 957 kr |
| Culture | 736,711,000 kr | 1,124 kr |
| Transport | 8,916,735,000 kr | 13,609 kr |
| Business development | 404,216,000 kr | 617 kr |
Amounts are in current prices, without inflation adjustment. Percentages use gross operating revenues as the denominator.
| Year | Residents at year end | Gross investment | Net loan debt % | Net operating result % |
|---|---|---|---|---|
| 2025 | 658,342 | 4,089,587,000 kr | 90.7 % | 5 % |
| 2024 | 655,210 | 3,934,814,000 kr | 92.5 % | 2.6 % |
| 2023 | 651,299 | 5,114,876,000 kr | 94.7 % | 5.1 % |
| 2022 | 646,205 | 6,008,633,000 kr | 88.6 % | 7.5 % |
| 2021 | 641,292 | 6,317,280,000 kr | 90.3 % | 9.1 % |
| 2020 | 638,821 | 5,142,680,000 kr | 92.8 % | 7.4 % |
| 2019 | — | — | — | — |
| 2018 | — | — | — | — |
| 2017 | — | — | — | — |
| 2016 | — | — | — | — |
| 2015 | — | — | — | — |
History follows SSB region codes. Mergers and boundary changes can break a time series, even when the code stays the same. Historical regions have not been combined into current boundaries.
Matches use the project’s recorded location. This does not mean the authority owns or funds the project. The collection is incomplete.
 Planned
Kombinert vei- og jernbaneutbygging mellom Arna og Stanghelle, planlagt som Norges største tunnelprosjekt
 Ongoing
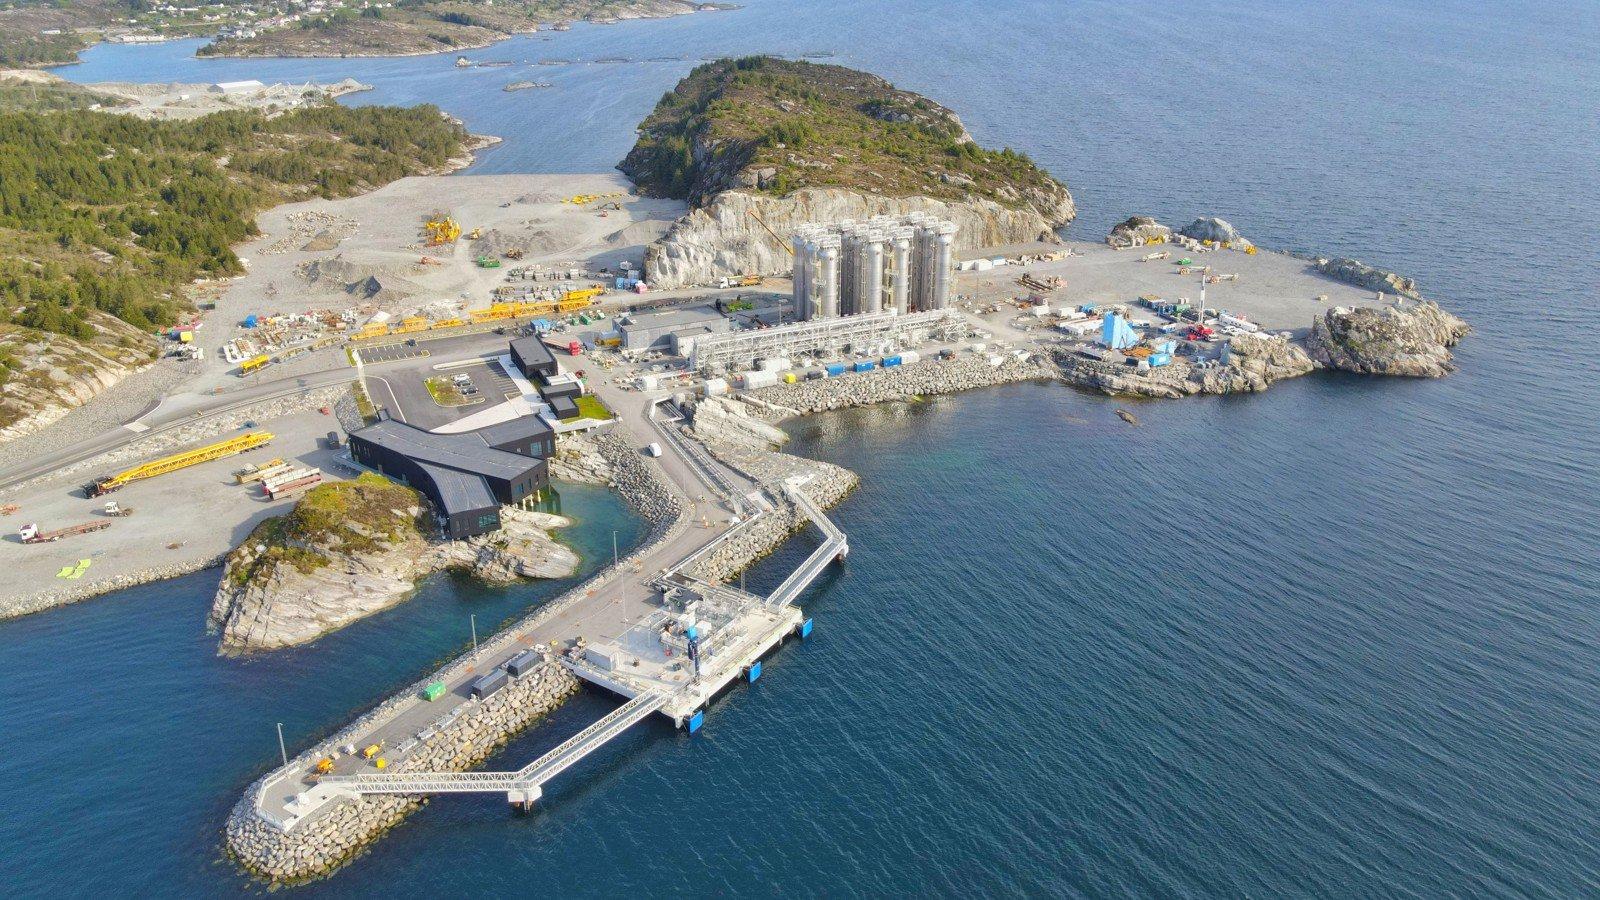
Norges fullskalaprosjekt for fangst, transport og permanent lagring av CO2 fra Brevik, Oslo og Nordsjøen
 Planned
Ferjefri E39 over verdens dypeste fjord – et av verdens mest teknisk krevende brosjekter, utsatt på ubestemt tid
 Planned
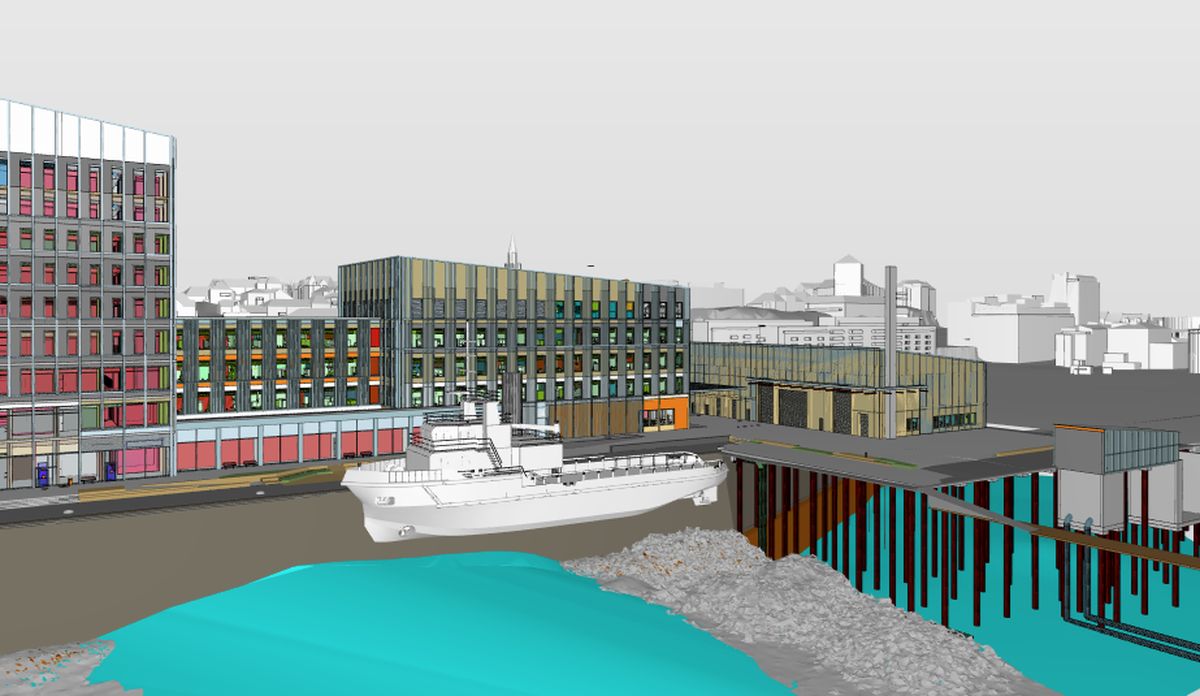
Samlokalisering av Havforskningsinstituttet og Fiskeridirektoratet i nybygg på Dokken i Bergen
 Planned
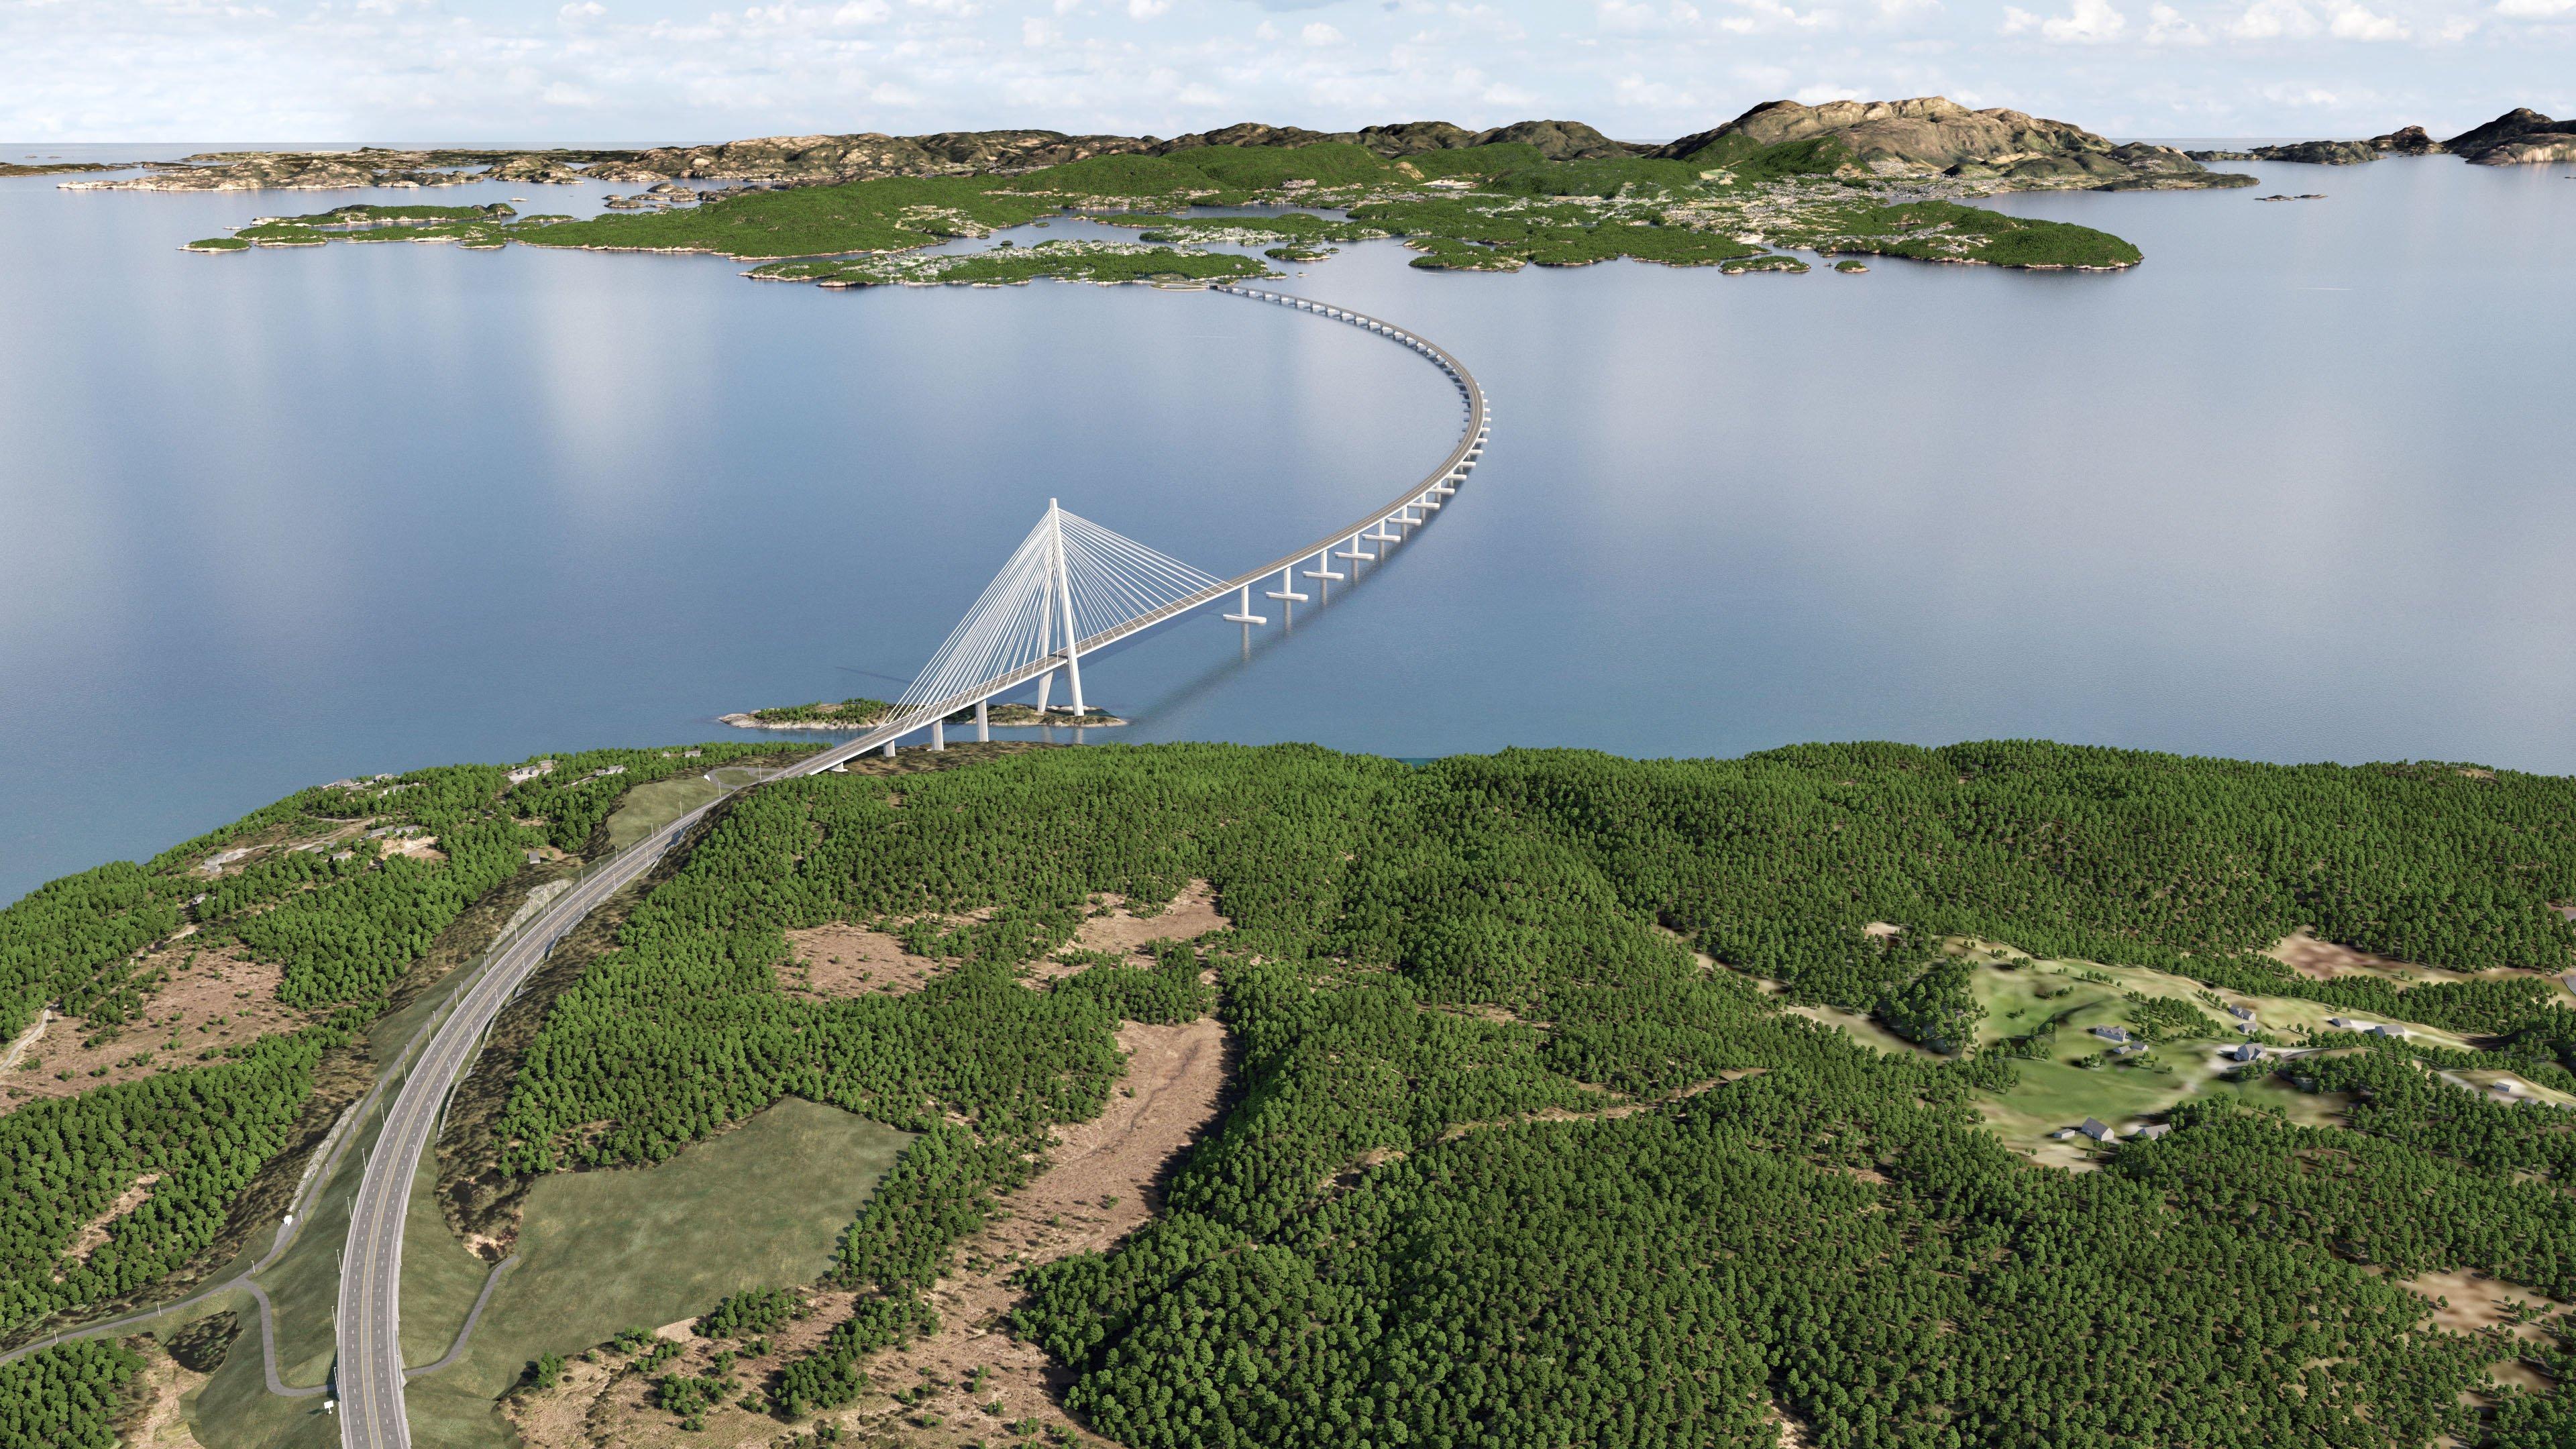
55 km ferjefri E39 med verdens lengste flytebru over Bjørnafjorden og Norges lengste bru
 Ongoing
Regionalt moderniseringsløp for sykehus og spesialisthelsetjenester i Vestland og Rogaland
PlannedFerjefri E39 over indre Nordfjord med hengebru med 1 550 m hovedspenn og tilknyttende tunneler – den mest samfunnsøkonomisk levedyktige av de nordlige E39-kryssingene
OngoingNytt avløpsrenseanlegg i Arna som skal erstatte dagens Garnes-anlegg og renseanlegget i Ytre Arna
 Planned
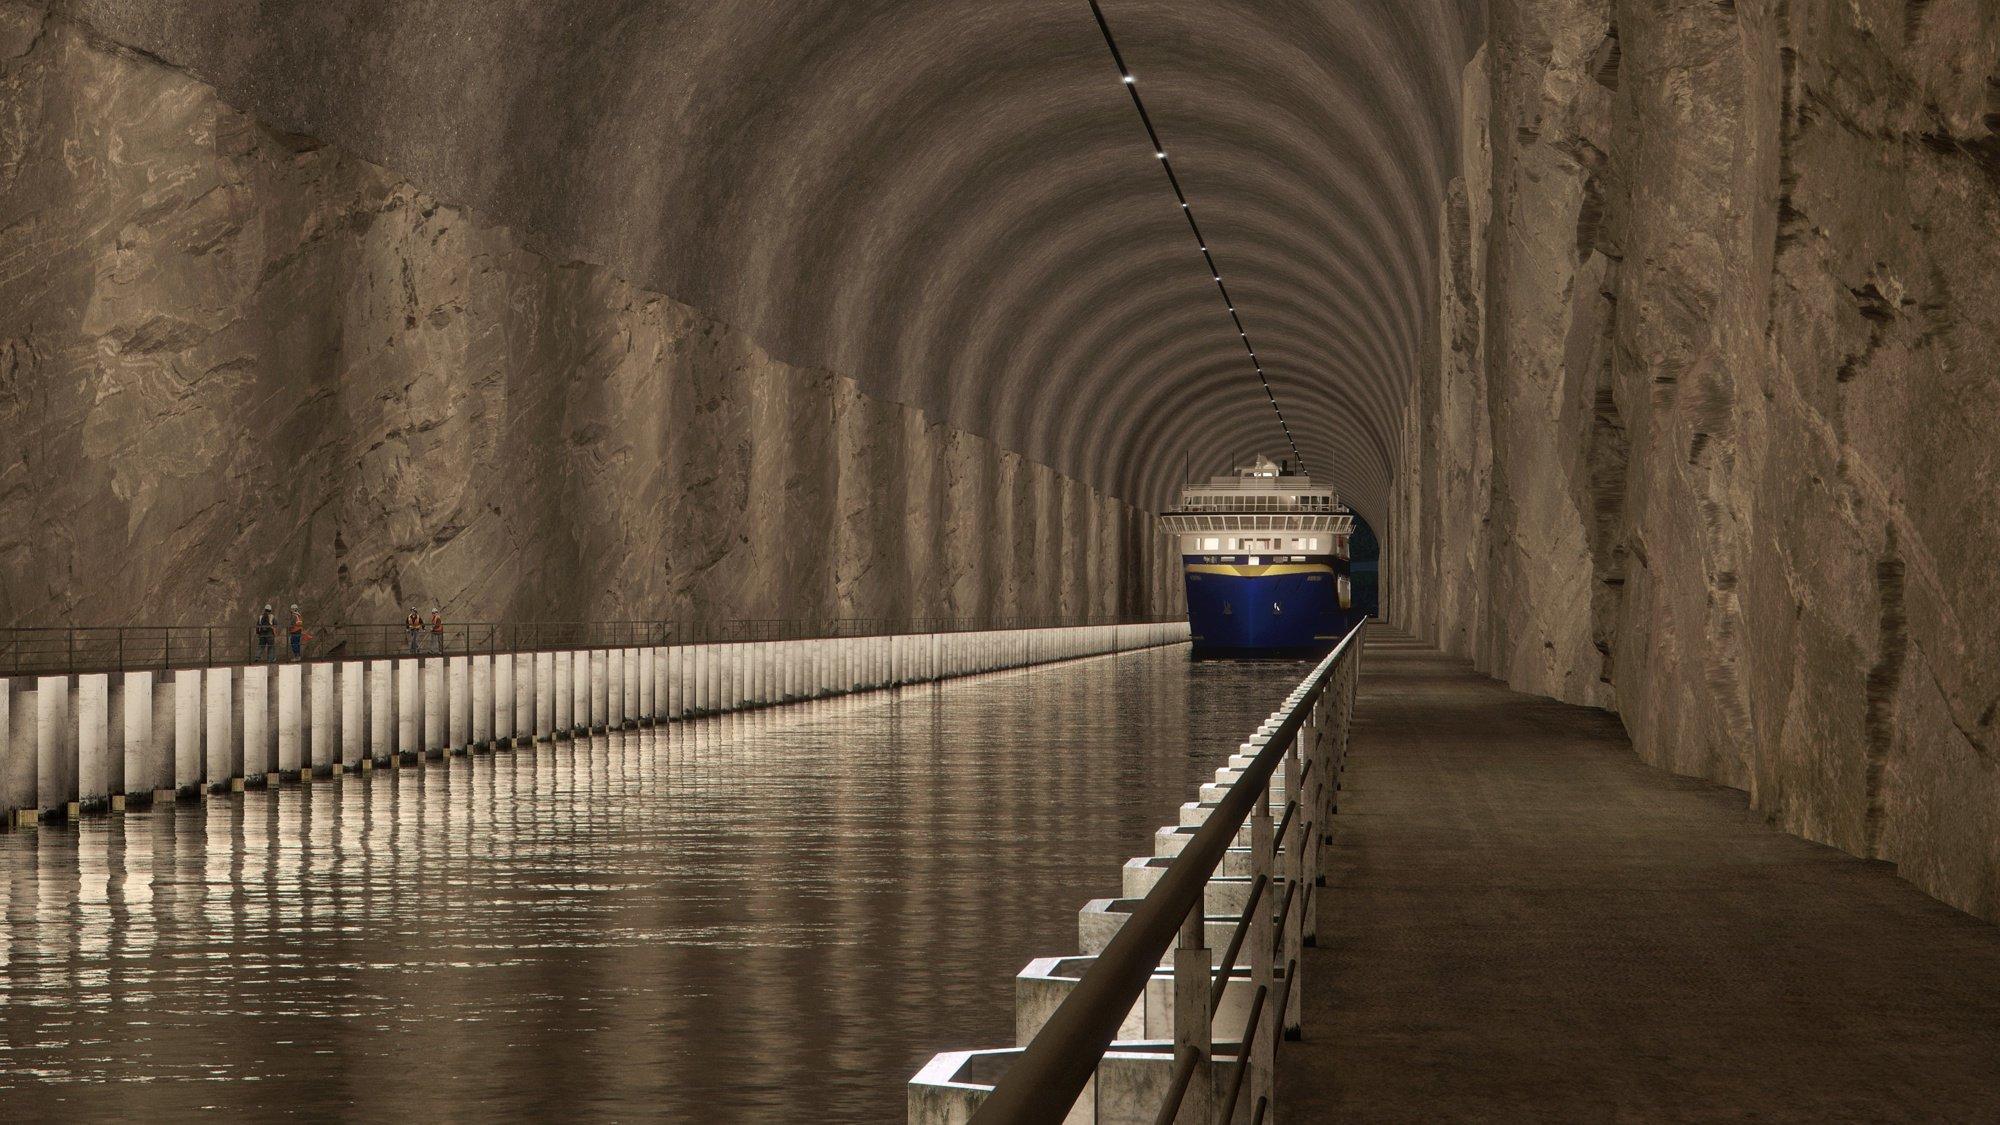
Verdens første skipstunnel gjennom Stad for å unngå farlig farvann
Statistics: Statistics Norway, CC BY 4.0. Geography and names: Kartverket.
Imported by NOMOP: 25 Oct 2026
Current administrative units. Boundaries are not used to rewrite historical statistical regions.
Source publication date: 15 Jun 2026 · Imported by NOMOP: 25 Oct 2026
Some chose key figures for the population of a County authority and the county groups.
[See list over changes in regional classifications](https://www.ssb.no/offentlig-sektor/kommunekatalog/endringer-i-de-regionale-inndelingene) (in Norwegian).
Source publication date: 15 Jun 2026 · Imported by NOMOP: 25 Oct 2026
The table shows a summary of the most relevant accounting figures in relation to the gross operating revenues and illustrates the financial capability of the county authorities. The figures are represented in NOK 1000 and as a percentage of the gross operating revenues.
For explanations of specific data issues, adjustments to published figures, breaks in time series, and municipal mergers, see [Structural explanations and the correction log (in Norwegian)](https://www.ssb.no/kostra/rettinger-i-tidligere-ars-publiserte-data).
Source publication date: 15 Jun 2026 · Imported by NOMOP: 25 Oct 2026
The table shows a summary of the most relevant accounting figures from the operational- and capital accounts for individual– and collective service areas grouped according to their sectors. The data is shown in percentage of the total operational expenditures, per capita and in absolute figures in NOK 1000.
It is important to note that the total percentage of operational expenditures for the services areas does not amount to 100 % in this table. This is as a result of some functions being included i various service areas and others excluded, and due to different artscope in numerators and denominators in some of the accounting concepts. Calculation of the percentages used in the numerators for functions and types (classifications): Property management functions 421, 430 and 510 are included in administration, county authorities functions (FGF1b) and county authorities secondary schools functions (FGF7). Classification types 710 and 729 is substracted from the adjusted gross operating expenditures and gross operating expenditures. Calculation of the percentages used in the denominator for functions and types (classifications) All functions are included. Classification types 710 and 729 is added in the gross operating expenditures. In adjusted gross operating expenditures types 710 is added whereas type 729 is deducted.
For explanations of specific data issues, adjustments to published figures, breaks in time series, and municipal mergers, see [Structural explanations and the correction log (in Norwegian)](https://www.ssb.no/kostra/rettinger-i-tidligere-ars-publiserte-data).