Residents at year end
728,714
31.12.
Municipality · 0301
Oslo performs both municipal and county functions. Its figures are therefore not directly comparable with other municipalities or counties.
Residents at year end
728,714
31.12.
Gross investment
23,035,443,000 kr
Per resident: 31,611 kr
Net loan debt
83.7 %
Share of gross operating revenues
Net operating result
3.7 %
Share of gross operating revenues
A dash means data is missing or unpublished. Missing figures are never treated as zero. Per-resident figures are calculated by NOMOP using the population at the end of the same year.
Gross operating expenditure for selected service areas. This is not a complete budget and should not be added up as a total.
| Service | NOK | Per resident |
|---|---|---|
| Administration | 3,299,275,000 kr | 4,528 kr |
| Kindergarten | 10,583,491,000 kr | 14,524 kr |
| Schools and adult education | 14,033,573,000 kr | 19,258 kr |
| Health, nursing and care | 23,140,845,000 kr | 31,756 kr |
| Culture | 4,009,744,000 kr | 5,502 kr |
| Transport | 1,846,936,000 kr | 2,535 kr |
| Water, sewage and waste | 3,409,955,000 kr | 4,679 kr |
| Child welfare | 2,063,277,000 kr | 2,831 kr |
Amounts are in current prices, without inflation adjustment. Percentages use gross operating revenues as the denominator.
| Year | Residents at year end | Gross investment | Net loan debt % | Net operating result % |
|---|---|---|---|---|
| 2025 | 728,714 | 23,035,443,000 kr | 83.7 % | 3.7 % |
| 2024 | 724,290 | 23,199,048,000 kr | 79.3 % | -0.9 % |
| 2023 | 717,710 | 18,707,400,000 kr | 68 % | -0.8 % |
| 2022 | 709,037 | 16,432,899,000 kr | 59.1 % | 5.4 % |
| 2021 | 699,827 | 14,130,636,000 kr | 53.3 % | 4.5 % |
| 2020 | 697,010 | 12,537,436,000 kr | 52.8 % | 3.7 % |
| 2019 | 693,491 | 12,751,043,000 kr | 49 % | 4.5 % |
| 2018 | 681,071 | 10,019,091,000 kr | 46.6 % | 5.2 % |
| 2017 | 673,468 | 8,924,207,000 kr | 42.2 % | 4.3 % |
| 2016 | 666,757 | 8,659,425,000 kr | 51.8 % | 3.6 % |
| 2015 | 658,390 | 10,178,762,000 kr | 51.4 % | 3.4 % |
History follows SSB region codes. Mergers and boundary changes can break a time series, even when the code stays the same. Historical regions have not been combined into current boundaries.
Matches use the project’s recorded location. This does not mean the authority owns or funds the project. The collection is incomplete.
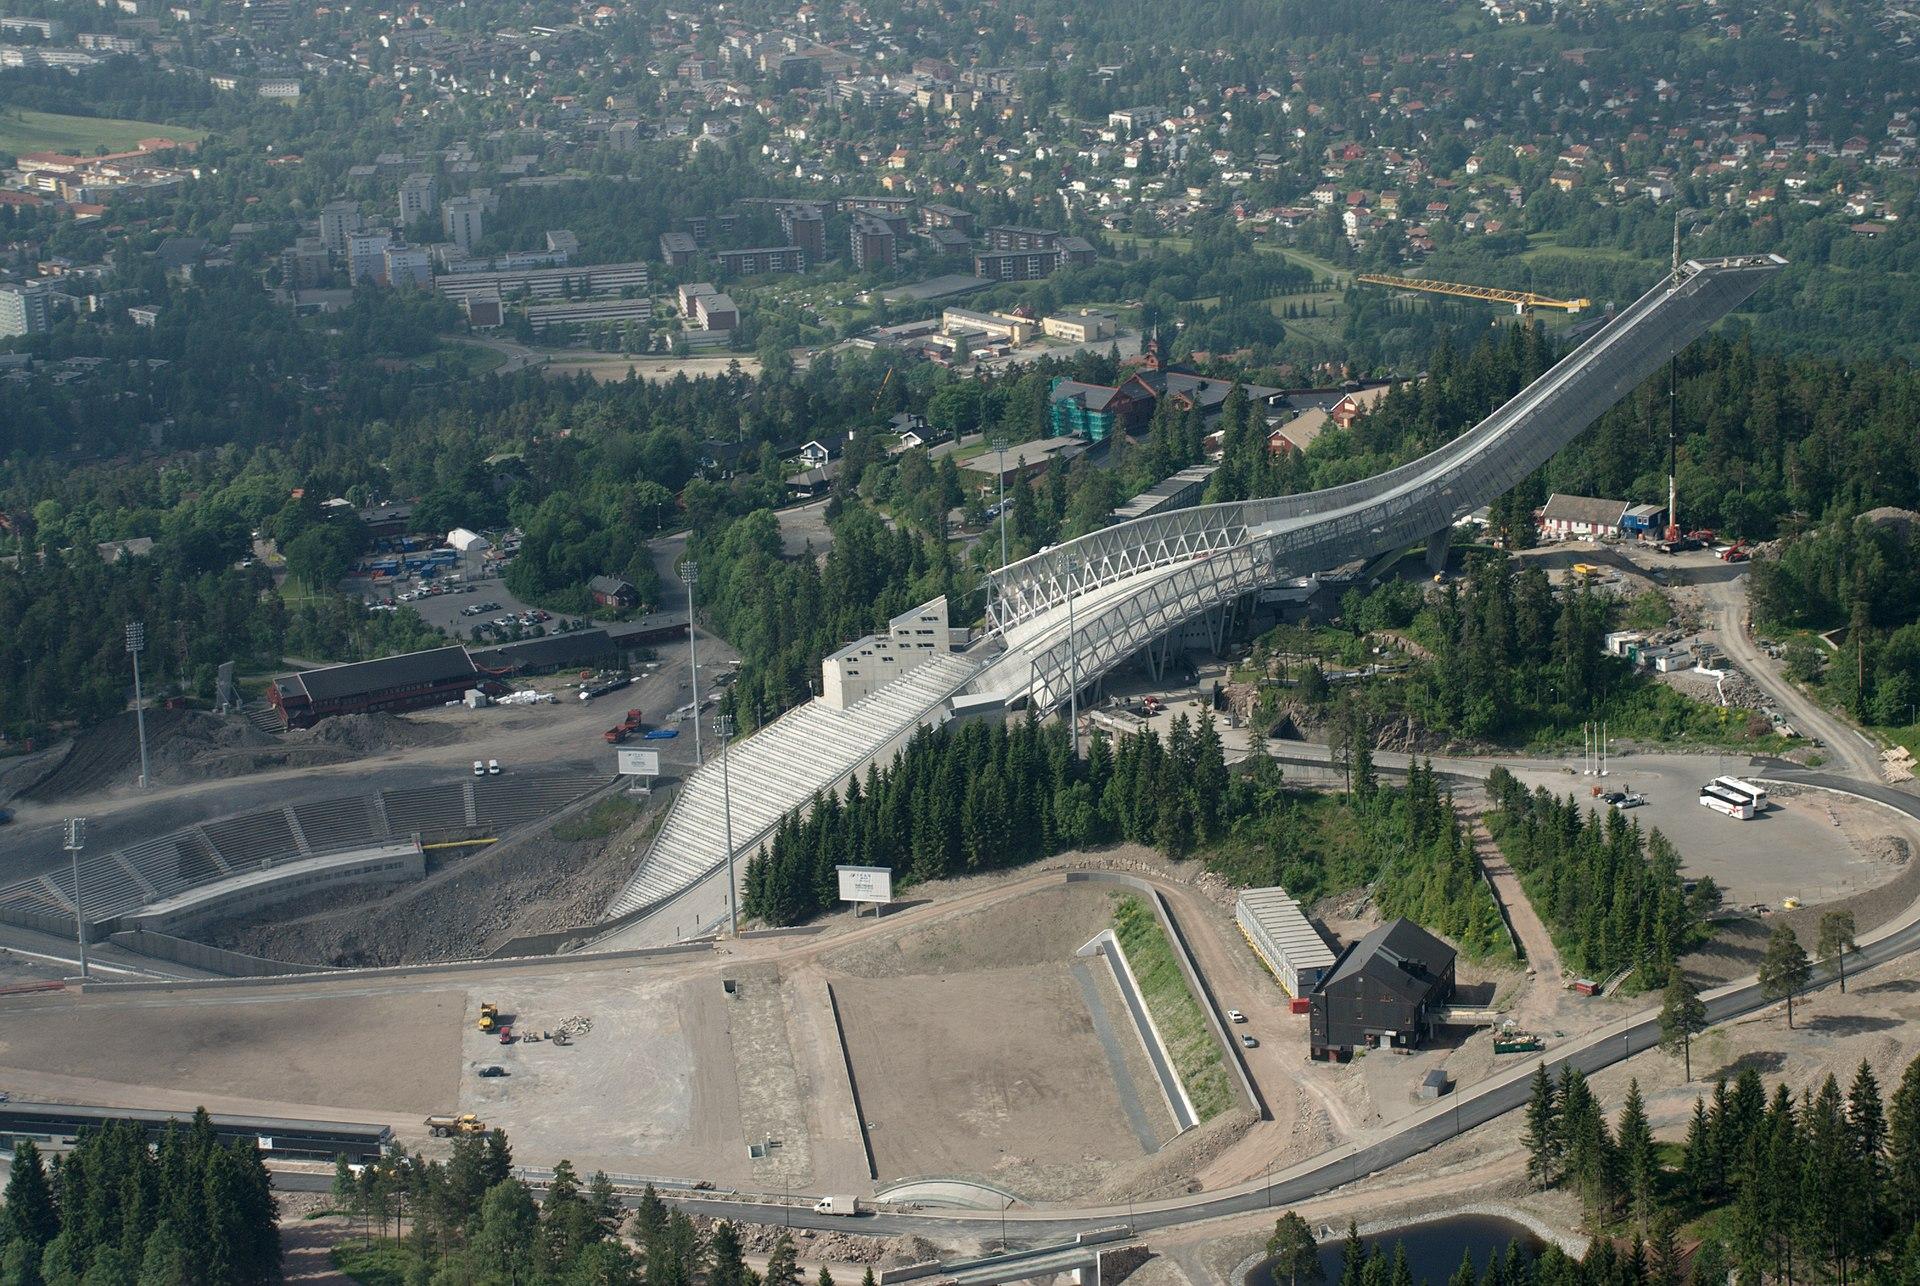 Completed
Ombygging av den ikoniske skihopp-anlegget i Oslo for VM 2011
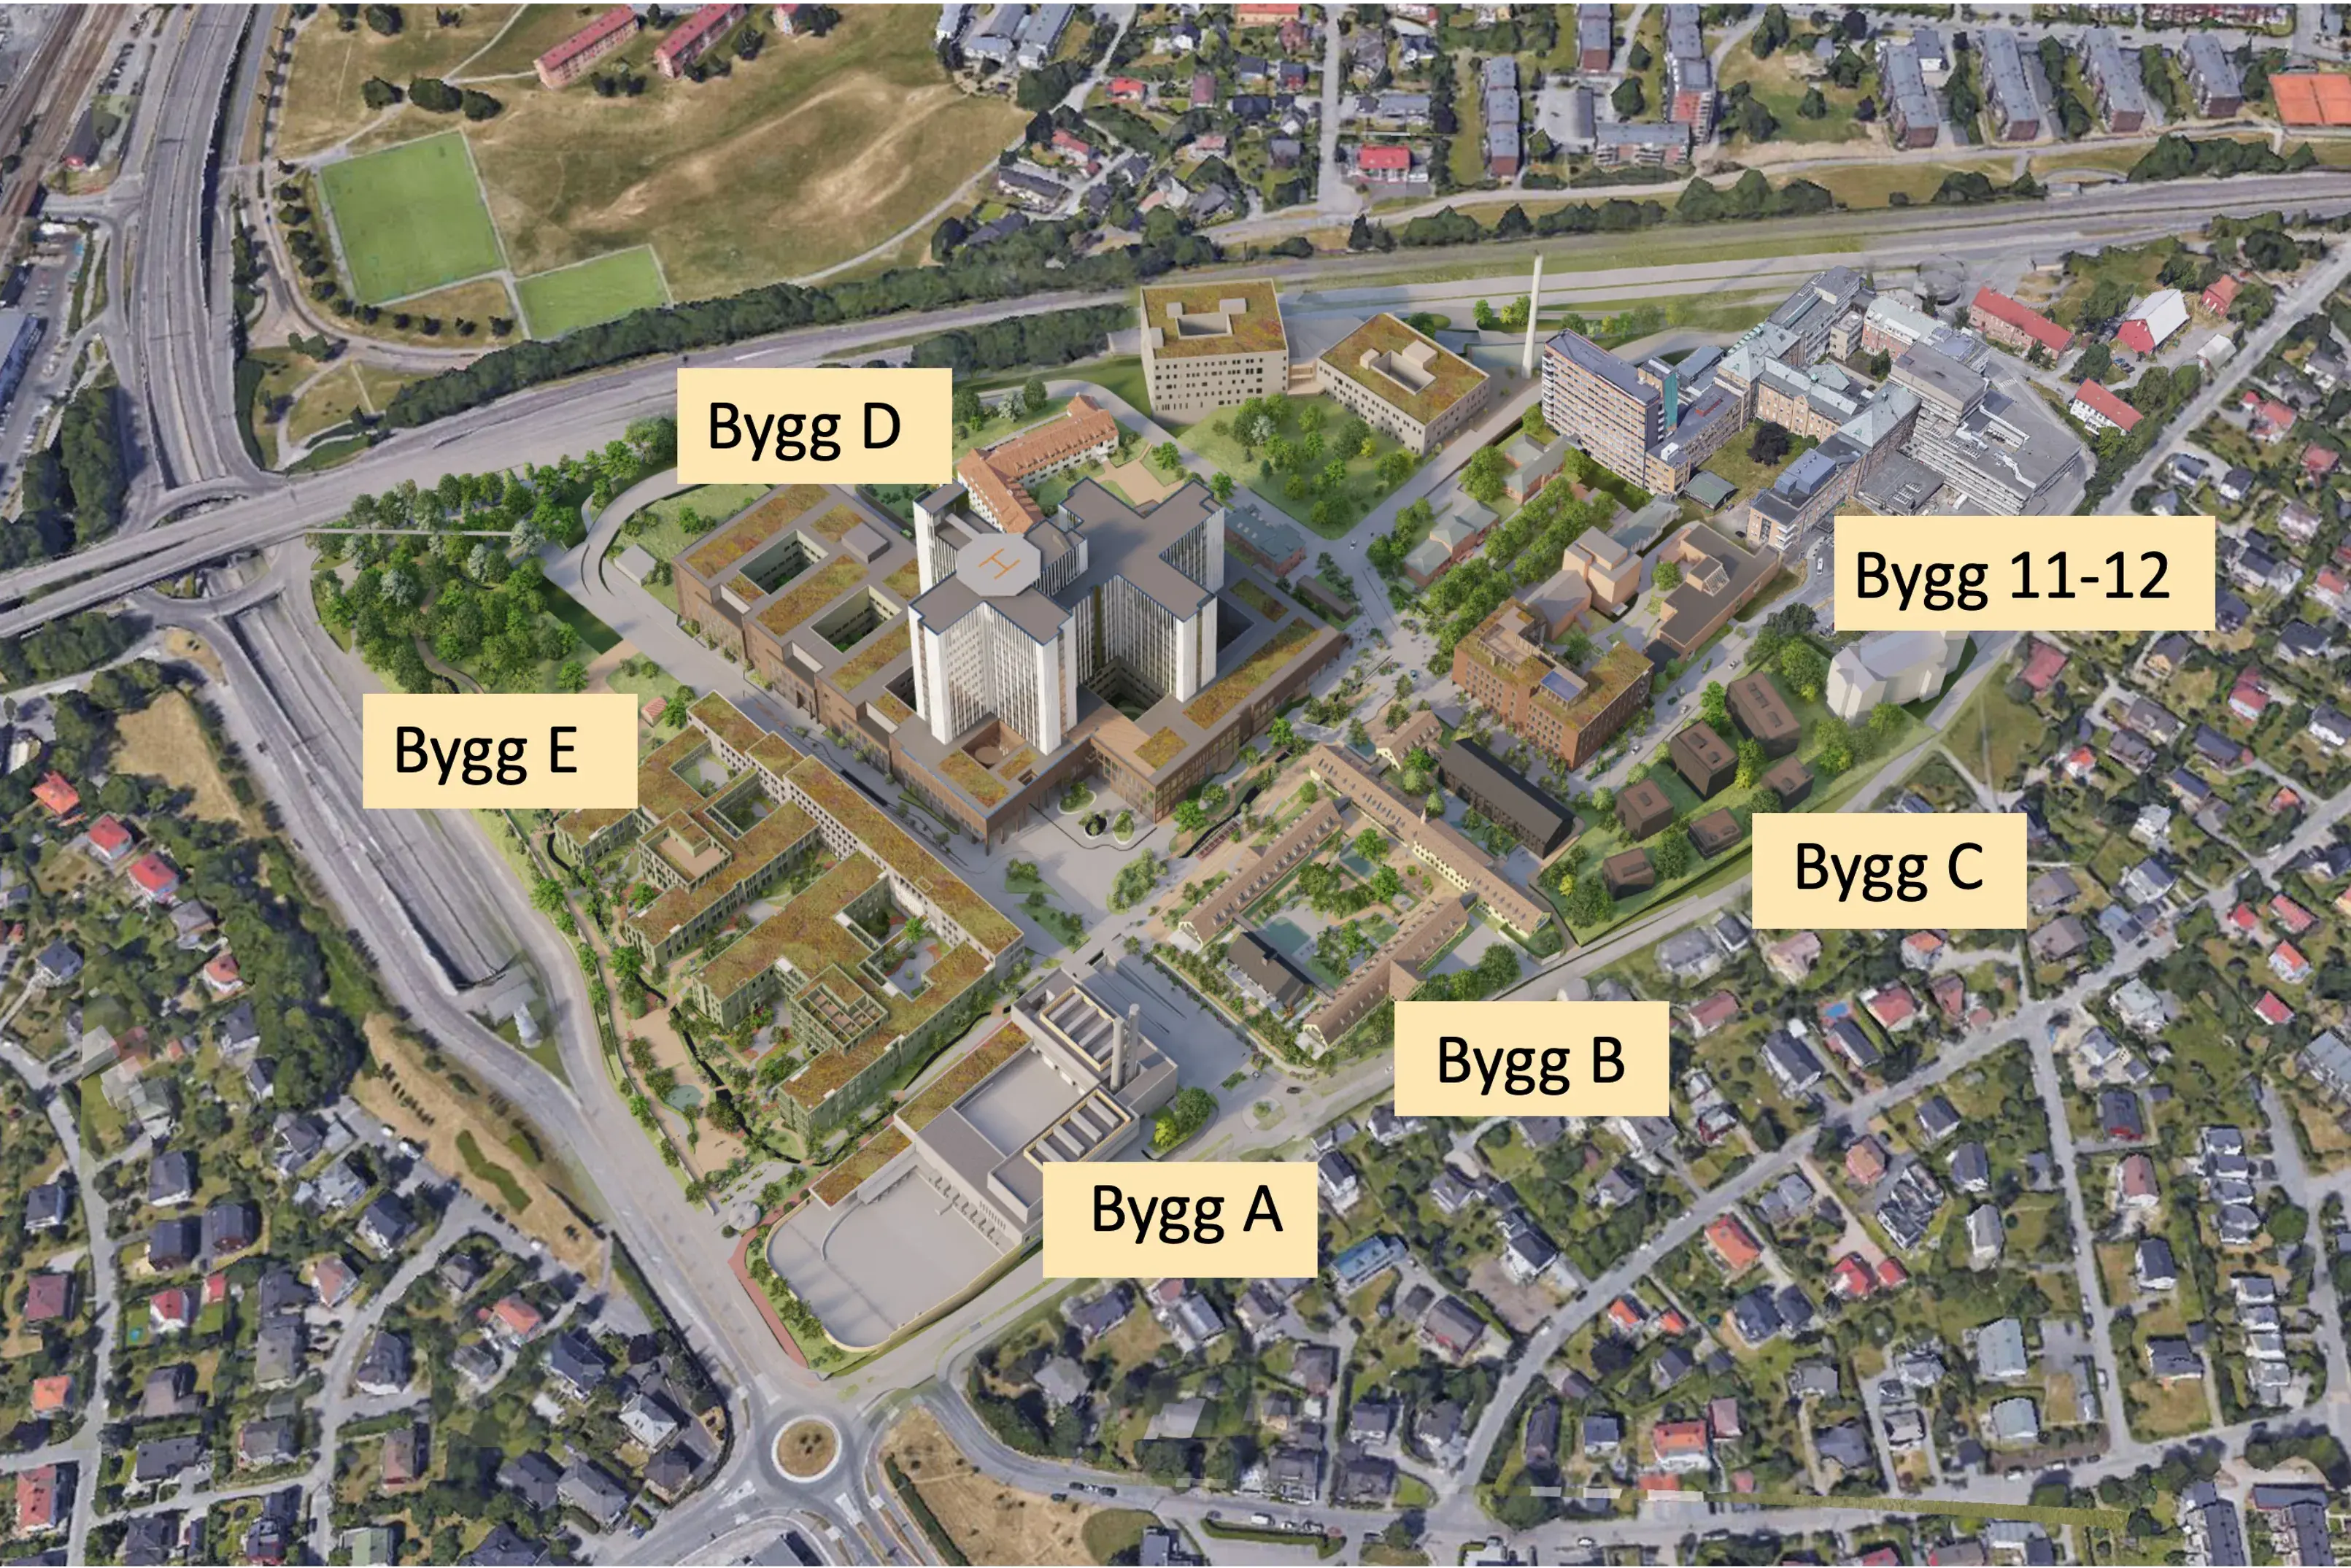 Ongoing
Nytt akuttsykehus og regionalt senter for psykisk helsevern og rusbehandling i Oslo
Det sterkt forsinkede badeanlegget i Oslo med en av de groveste kostnadssprekkene i kommunens byggportefølje
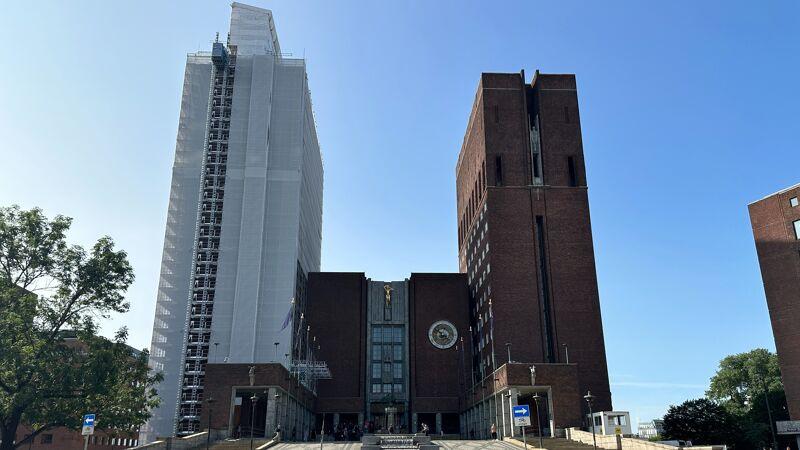 Ongoing
Utvendig rehabilitering av Oslo rådhus med fasader, tårn, vinduer, takarbeider og tiltak for bedre tilgjengelighet
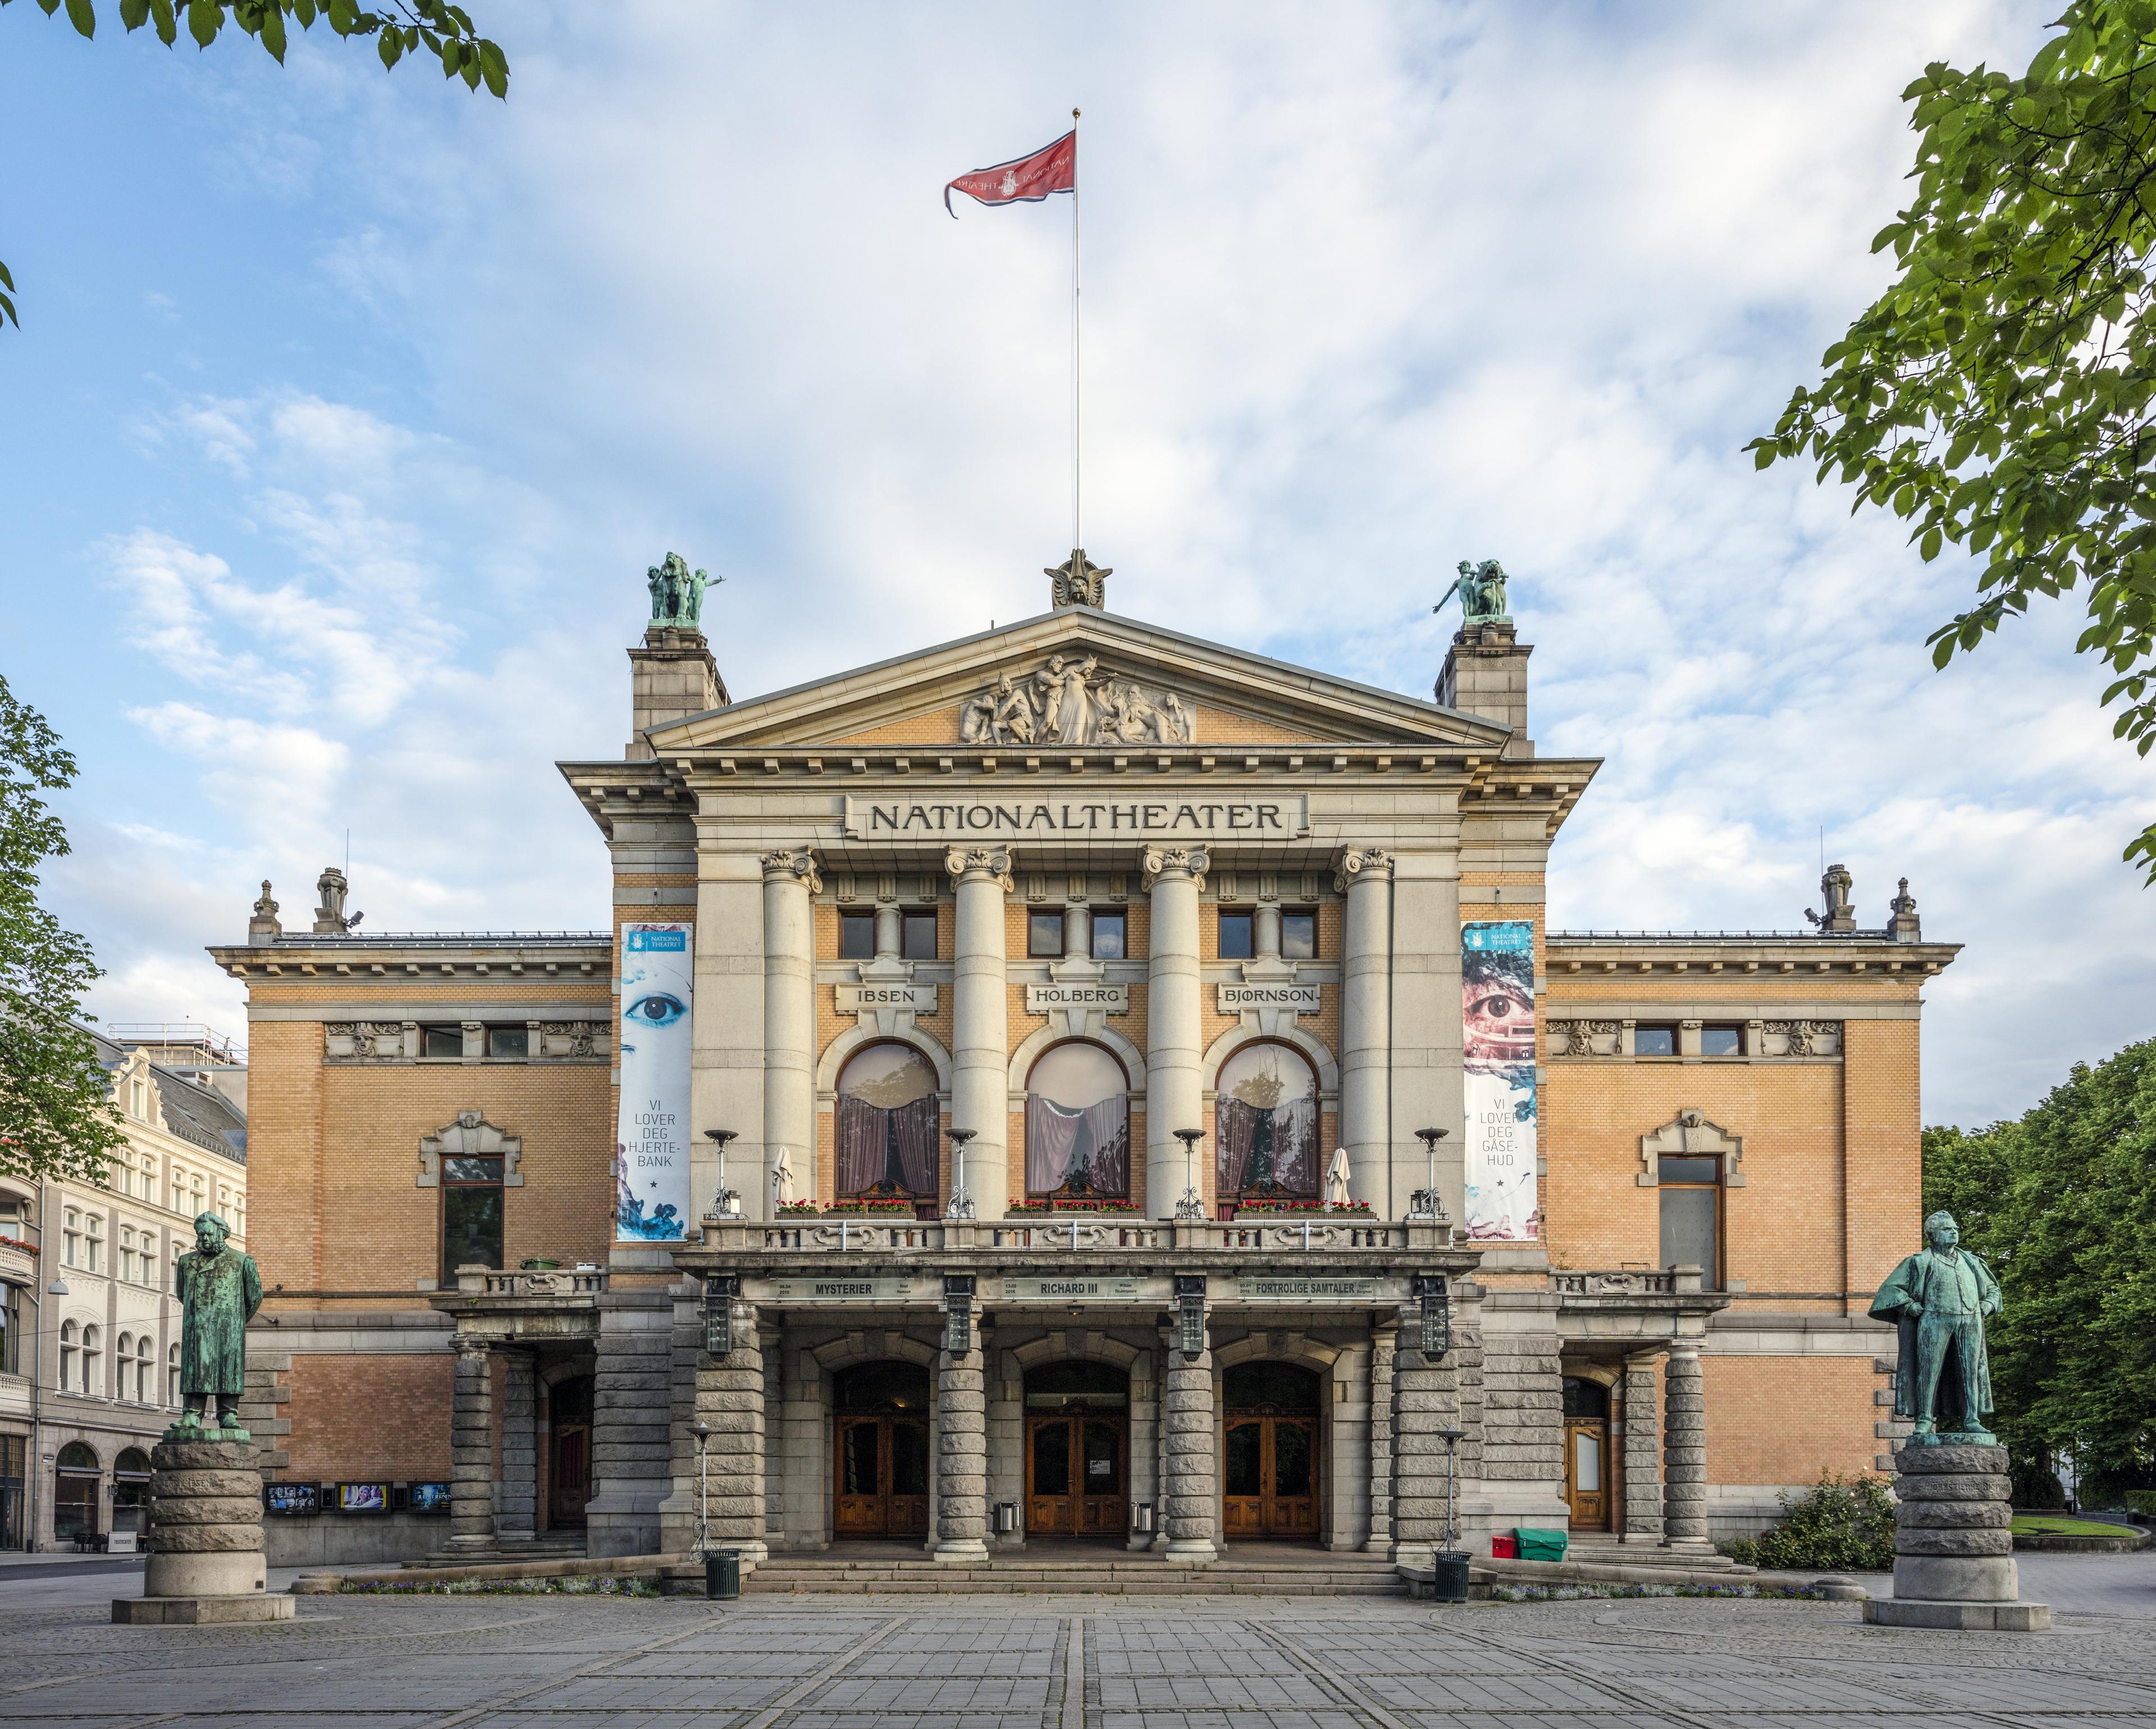 Planned
Statlig rehabiliterings- og sceneprosjekt for Nationaltheatret i Oslo
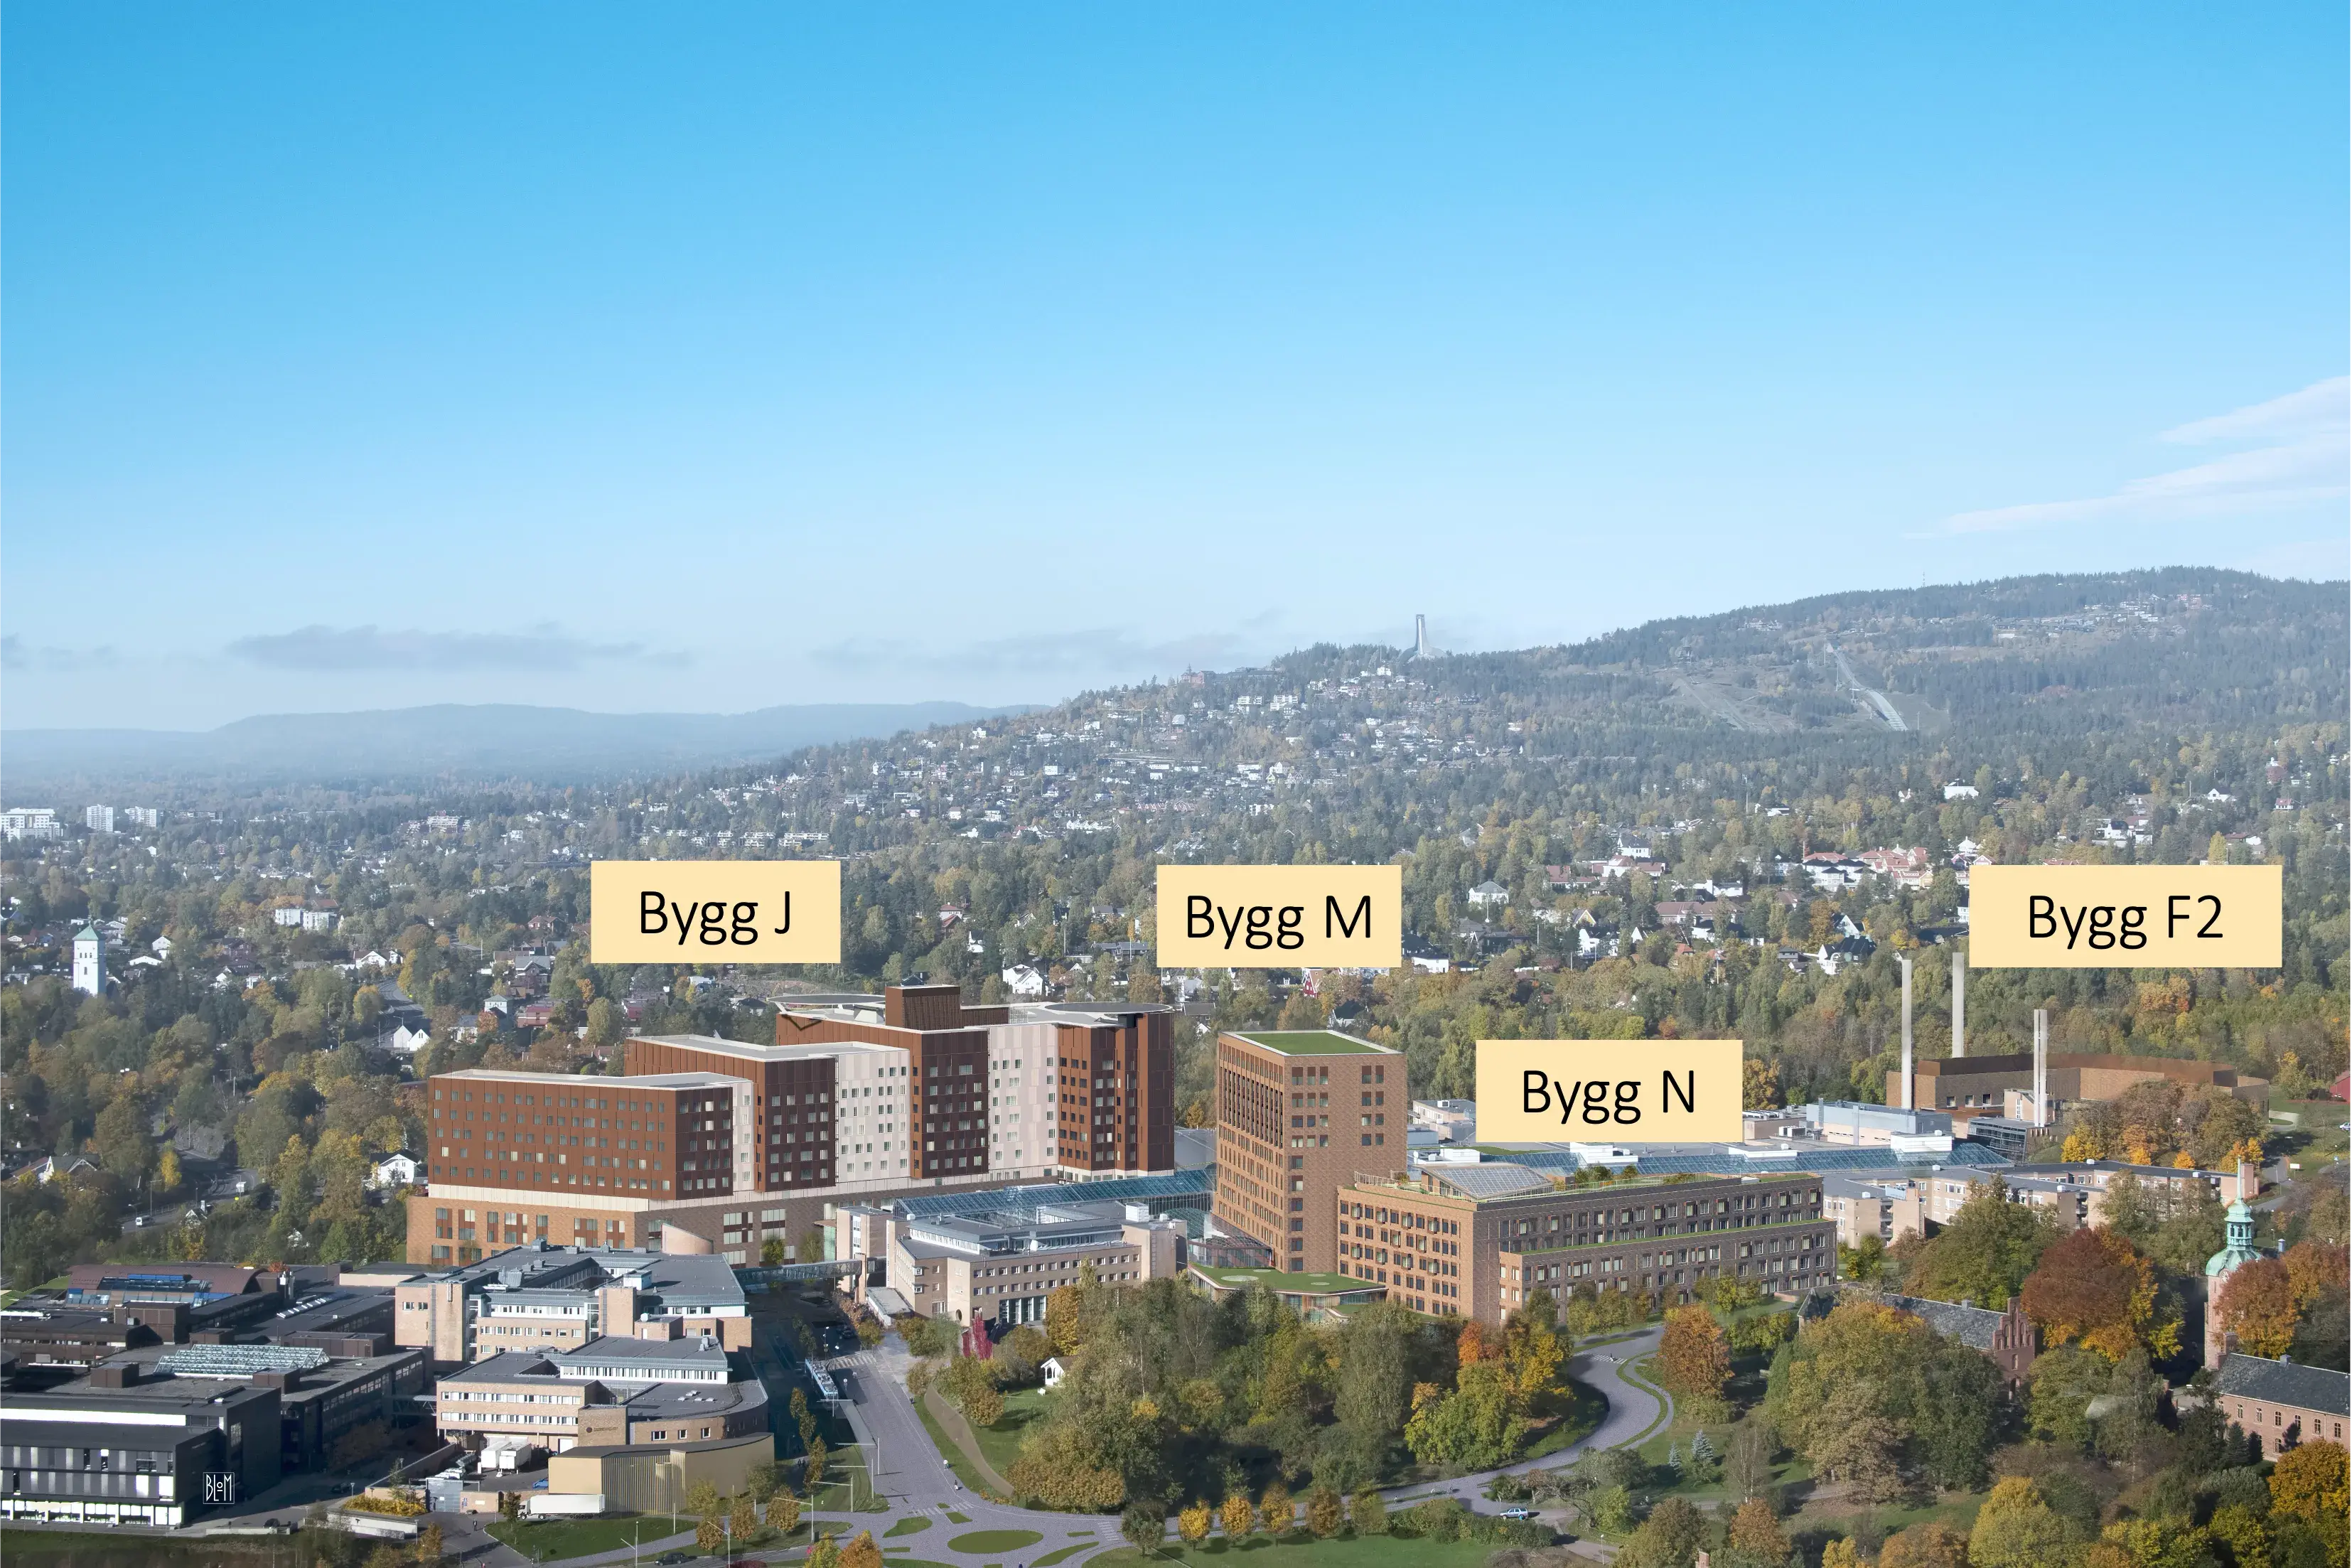 Ongoing
Stor utbygging av Rikshospitalet for å samle regionale og nasjonale spesialistfunksjoner
 Ongoing
Landets største universitets- og sykehusbygg for tverrfaglig livsvitenskap ved UiO og OUS
 Ongoing
Kommunalt program for utvikling, drift og modernisering av skolebygg i Oslo
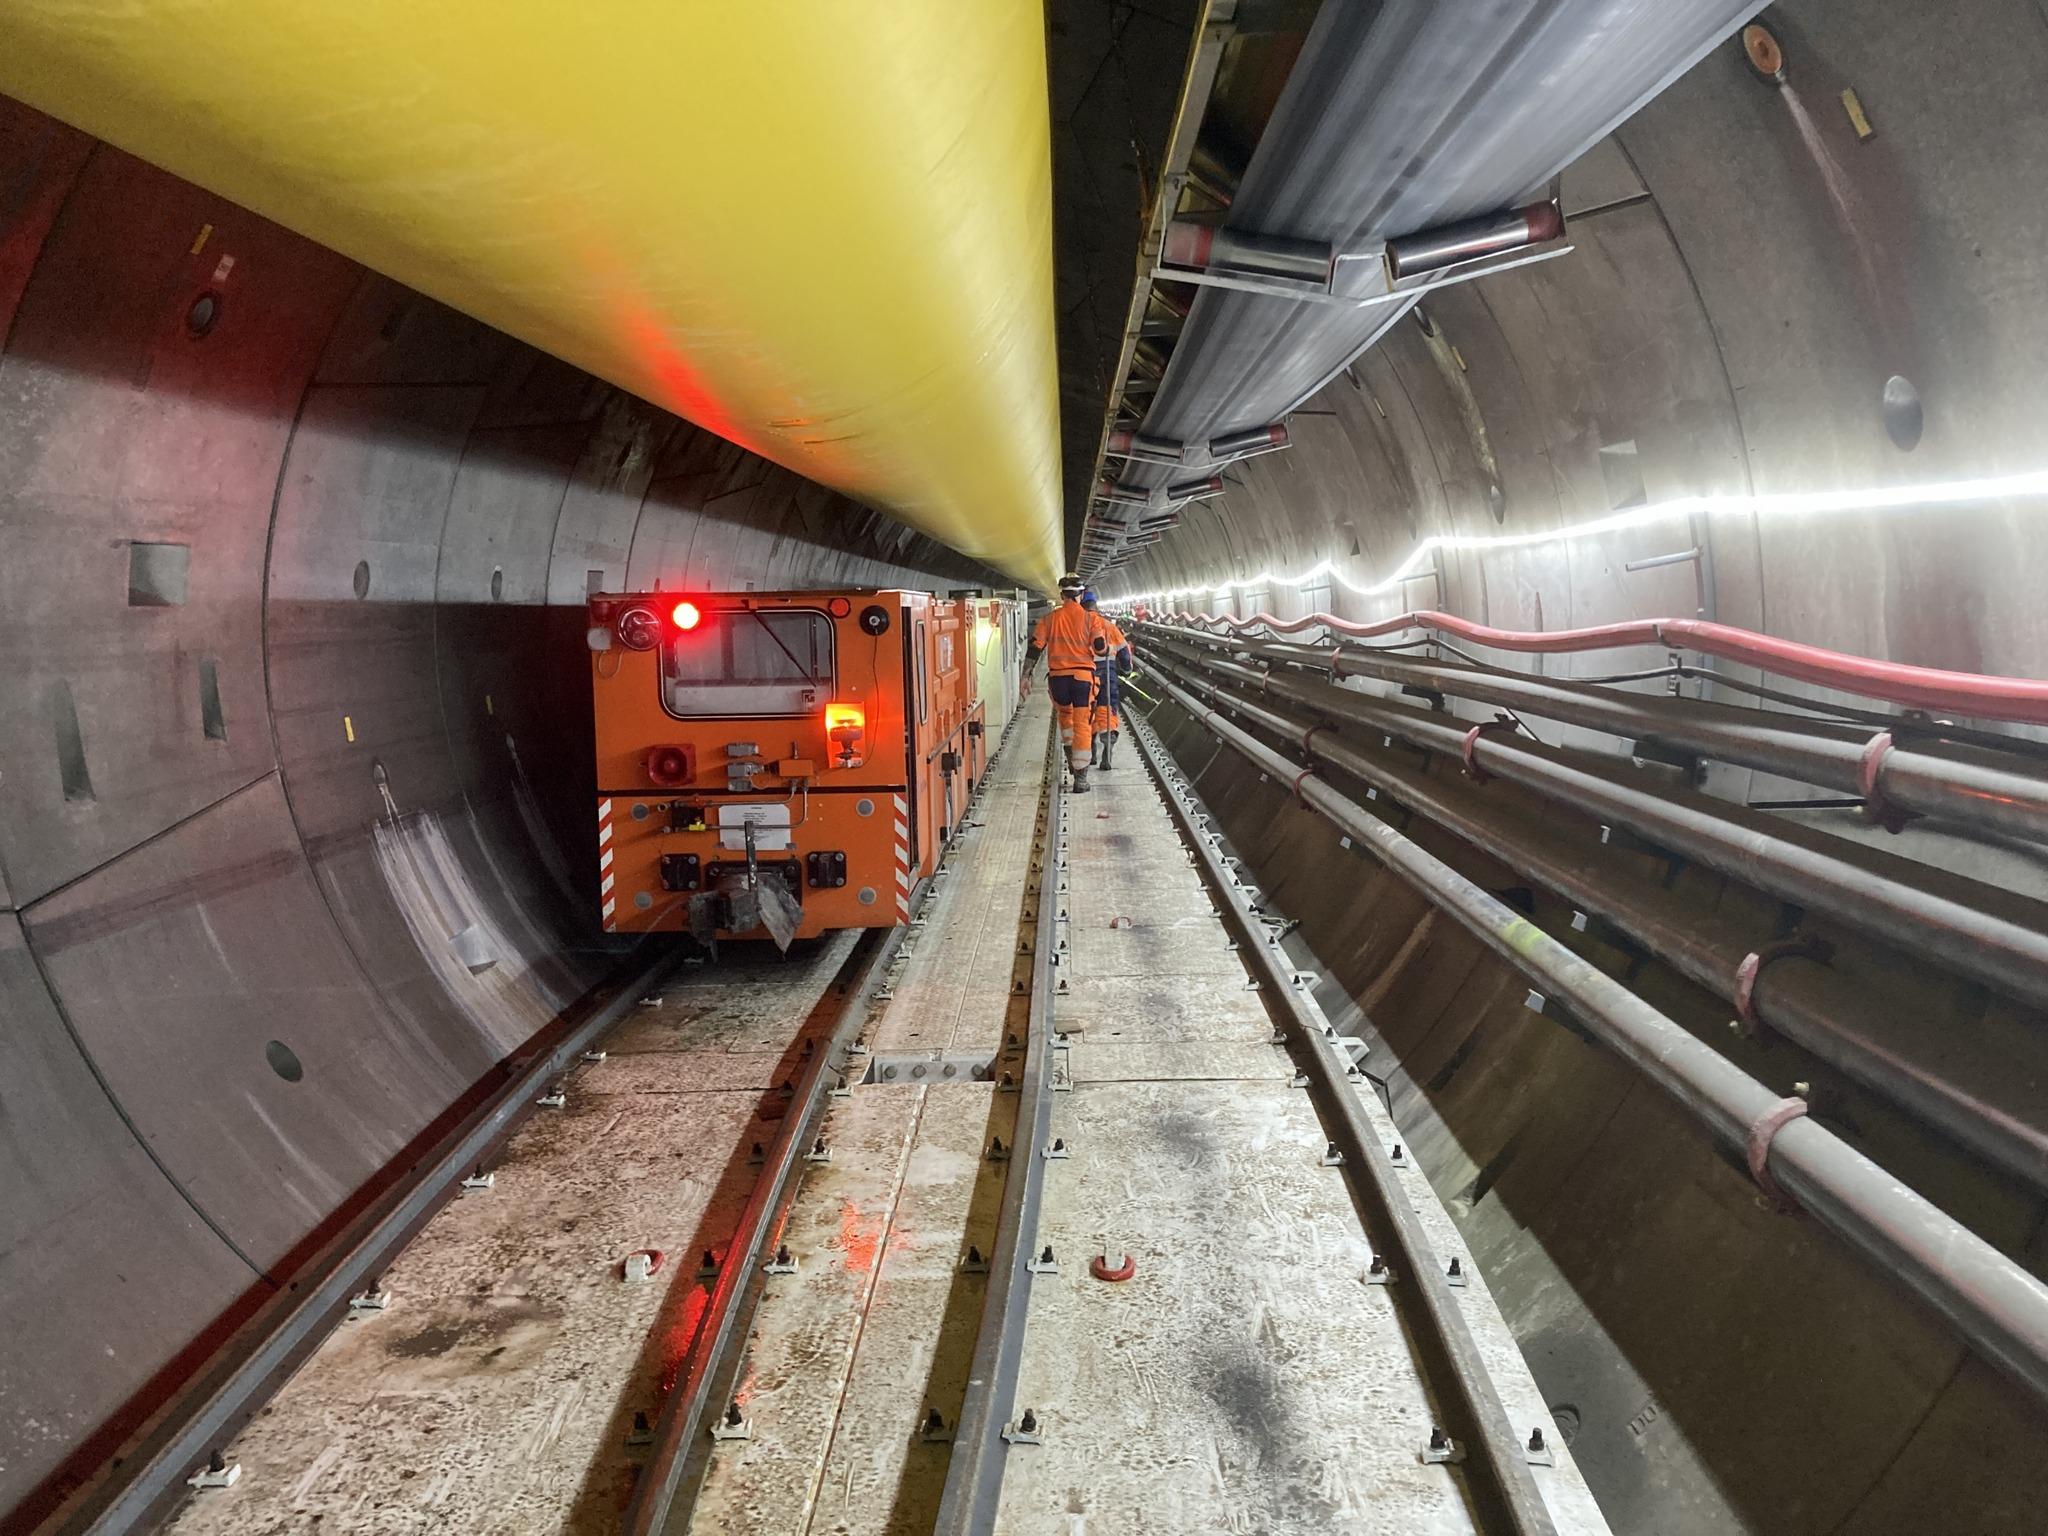 Ongoing
Erstatning av Oslos utdaterte vannforsyningssystem med ny hovedvannledning
 Completed
Hovedbiblioteket i Bjørvika og en sentral del av Deichmans biblioteknettverk i Oslo
Nytt hovedbad i Oslo etter et langvarig og dyrt ombyggingsprosjekt
 Ongoing
Et av verdens største digitaliseringsprosjekter - digitalisering av hele samlingen
Den omstridte barnehagen som ble et symbol på offentlig sløsing
Statistics: Statistics Norway, CC BY 4.0. Geography and names: Kartverket.
Imported by NOMOP: 25 Oct 2026
Current administrative units. Boundaries are not used to rewrite historical statistical regions.
Source publication date: 15 Jun 2026 · Imported by NOMOP: 25 Oct 2026
Some selected key figures for the population of a municipality
[See list over changes in regional classifications](https://www.ssb.no/offentlig-sektor/kommunekatalog/endringer-i-de-regionale-inndelingene) (in Norwegian).
Source publication date: 15 Jun 2026 · Imported by NOMOP: 25 Oct 2026
The table shows a summary of the most relevant accounting figures in relation to the gross operating revenues and illustrates the financial capability of the county authorities. The figures are represented in NOK 1000 and as a percentage of the gross operating revenues.
There is a breake in the timeseries for the KOSTRA-group-municipalities between 2019 and 2020, due to altered grouping concerning the three different dimensions population, restricted costs and unrestricted disposable income per capita. For further information of the groups, see [code-lists for KOSTRA - groups in 2019 and 2020](https://www.ssb.no/klass/klassifikasjoner/112/versjoner).
For explanations of specific data issues, adjustments to published figures, breaks in time series, and municipal mergers, see [Structural explanations and the correction log (in Norwegian)](https://www.ssb.no/kostra/rettinger-i-tidligere-ars-publiserte-data).
Source publication date: 15 Jun 2026 · Imported by NOMOP: 25 Oct 2026
The table shows a summary of the most relevant accounting figures from the operational- and capital accounts for individual– and collective service areas grouped according to their sectors. The data is shown in percentage of the total operational expenditures, per capita and in absolute figures in NOK 1000.
It is important to note that the total percentage of operational expenditures for the services areas does not amount to 100 % in this table. This is as a result of some functions being included i various service areas and others excluded, and due to different artscope in numerators and denominators in some of the accounting concepts. Calculation of the percentages used in the numerators for functions and types (classifications): Property management functions 121, 130, 221, 222, 261, 381 and 386 are included in administration, municipalities functions (FGF1b), in kindergarten functions (FGK7), in primary schools functions (FGK8) and in culture area functions (FGK2). Finance functions (800..899) are not included in any of the service areas. Classification types 710 and 729 is substracted from the adjusted gross operating expenditures and gross operating expenditures. Calculation of the percentages used in the denominator for functions and types (classifications). All functions are included. Classification types 710 and 729 is added in the gross operating expenditures. In adjusted gross operating expenditures types 710 is added whereas type 729 is deducted.
There is a breake in the timeseries for the KOSTRA-group-municipalities between 2019 and 2020, due to altered grouping concerning the three different dimensions population, restricted costs and unrestricted disposable income per capita. For further information of the groups, see [code-lists for KOSTRA - groups in 2019 and 2020](https://www.ssb.no/klass/klassifikasjoner/112/versjoner).
For explanations of specific data issues, adjustments to published figures, breaks in time series, and municipal mergers, see [Structural explanations and the correction log (in Norwegian)](https://www.ssb.no/kostra/rettinger-i-tidligere-ars-publiserte-data).